
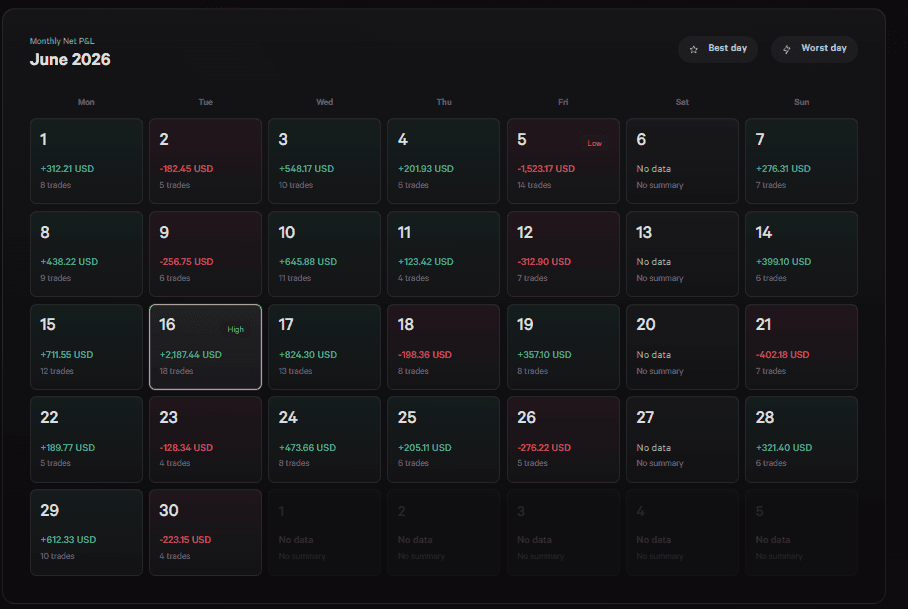
Win rate describes how often trades win. Profit factor describes how much gross profit was produced for each unit of gross loss. Neither metric is useful without payoff, costs, and sample size.
Apply this workflow in the Dojournal portfolio view and check account limits by plan before connecting a larger portfolio.
Key takeaways
- Win rate is winning closed trades divided by all closed trades in the sample.
- Profit factor is gross profit divided by the absolute value of gross loss.
- A high win rate can lose money when occasional losses are much larger than normal wins.
- Compare like-for-like samples and inspect the trades behind the aggregate.
Win rate measures frequency
Win rate answers a narrow question: what percentage of closed trades in this sample were profitable? If 40 of 100 closed positions made money, the win rate is 40%. Decide how break-even trades are treated and keep that rule consistent.
Frequency affects the experience of a strategy, but it does not show the size of wins or losses. A strategy can win often and still lose money if its losing trades are much larger.
Win rate = winning closed trades ÷ total closed trades × 100
Profit factor measures payoff across the sample
Add all profitable closed-trade results to get gross profit. Add the absolute values of all losing results to get gross loss. Dividing gross profit by gross loss gives profit factor. A value above 1 means gross profit exceeded gross loss before any costs not already included in the trade results.
A profit factor of 1.50 means the sample produced 1.50 units of gross profit for each unit of gross loss. It does not mean the account returned 50%.
Profit factor = gross profit ÷ |gross loss|
Why a lower win rate can produce a better result
Consider ten trades. Strategy A wins four times at 200 each and loses six times at 80 each. Gross profit is 800, gross loss is 480, and profit factor is 1.67 despite a 40% win rate.
Strategy B wins seven times at 50 each and loses three times at 150 each. Its 70% win rate feels smoother, but gross profit is 350, gross loss is 450, and profit factor is 0.78. The difference is payoff, not frequency.
Check costs, outliers, and sample size
A handful of trades can produce an impressive profit factor by chance or through one unusually large winner. Compare the metric across meaningful periods and inspect how much of gross profit came from the largest trade or day.
Use net results after commission and swap where possible. Also compare average win, average loss, expectancy, maximum drawdown, and position size. Metrics from different instruments or strategies should not be combined blindly when their risk units differ.
Use both metrics as questions, not grades
If win rate falls but profit factor improves, larger winners or smaller losses may be doing useful work. If win rate rises while profit factor falls, check whether losses grew or winners were cut early.
The next step is always to open the underlying trades and test the pattern by strategy, market session, setup, and risk size. The aggregate points you toward the review; it does not replace it.
Continue with a related topic in the Dojournal MetaTrader 5 article library.
Sources
The Dojournal editorial team reconciled the definitions with MetaTrader 5 documentation and checked the workflow against the current portfolio views. This is educational content, not investment advice.
Reviewed and maintained by Dojournal Editorial Team