
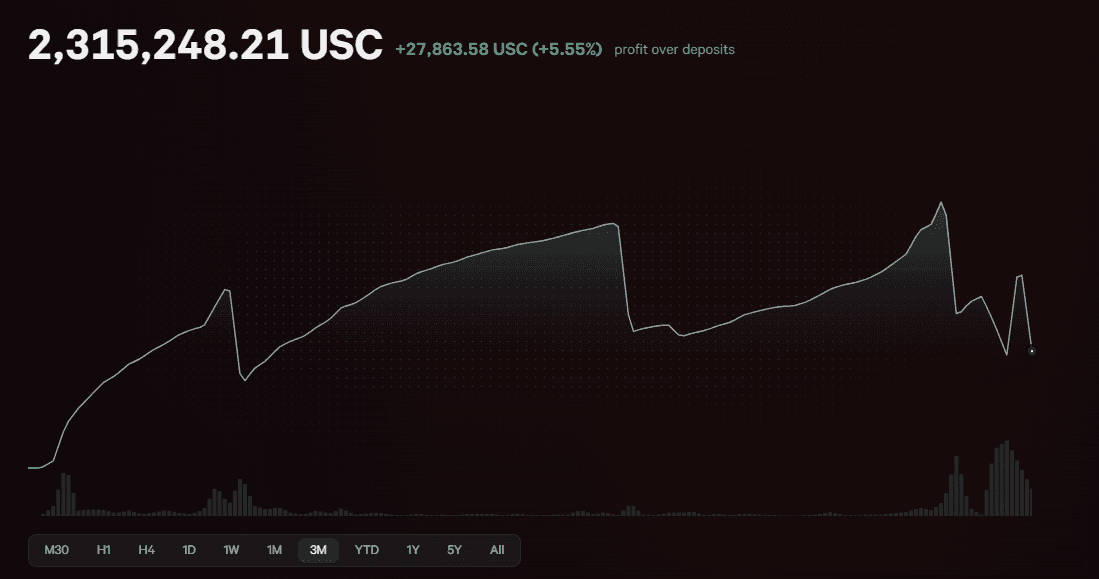
Drawdown measures the decline from a prior account peak to a later trough. The answer changes depending on whether you use balance or equity, money or percentage, and the sampling frequency.
Apply this workflow in the Dojournal portfolio view and check account limits by plan before connecting a larger portfolio.
Key takeaways
- Maximum drawdown is the largest peak-to-later-trough decline in the selected series.
- Balance drawdown ignores unrealized movement; equity drawdown includes open-position risk.
- State the period, series, currency, and sampling interval whenever you report drawdown.
- Use drawdown with recovery time and position-size concentration—not as a standalone score.
Drawdown begins at a peak
A drawdown begins when an account value falls below its previous high-water mark. It continues until the series reaches a new high or the review period ends. The largest decline from any peak to a later trough is maximum drawdown.
A loss is not automatically a full drawdown. Several gains and losses can belong to the same drawdown episode if the account has not recovered its prior peak.
Drawdown % = (peak value − current value) ÷ peak value × 100
Balance and equity answer different questions
Balance drawdown uses values after trades and balance operations are booked. It is stable and easy to reproduce, but it can hide severe unrealized losses that later recover before a position closes.
Equity drawdown includes balance plus the changing value of open positions. It better represents risk experienced while trades are open, but its accuracy depends on how often equity was sampled. A daily snapshot can miss a deep intraday trough.
Calculate maximum drawdown step by step
Order the selected balance or equity observations chronologically. Keep a running peak. At each observation, calculate the decline from that peak in money and percentage terms. The largest decline recorded is the maximum drawdown for that dataset.
Suppose equity rises from 100,000 to 112,000, falls to 98,560, then reaches 116,000. The peak before the fall is 112,000 and the trough is 98,560. The money drawdown is 13,440 and the relative drawdown is 12%. The next high at 116,000 closes that drawdown episode.
(112,000 − 98,560) ÷ 112,000 = 12% maximum drawdown
Handle deposits and withdrawals explicitly
External cash flows can create false peaks or troughs. A deposit increases the account base without trading profit; a withdrawal can look like a loss if the series is not adjusted. Use a cash-flow-adjusted return series or reset the comparison base when a material external flow occurs.
Document the method. Two platforms can report different drawdown values because one uses balance after closed trades and another uses intraday equity adjusted for flows.
Read drawdown with depth, time, and concentration
Depth tells you how far the account fell. Duration tells you how long it stayed below the peak. Recovery tells you how much gain was required to return. A 20% drawdown needs a 25% gain from the trough to recover because the new base is smaller.
Also inspect which days, symbols, and position sizes created the decline. The same 10% maximum drawdown has a different risk meaning when it came from one oversized trade instead of many normal losses within plan.
Continue with a related topic in the Dojournal MetaTrader 5 article library.
Sources
The Dojournal editorial team reconciled the definitions with MetaTrader 5 documentation and checked the workflow against the current portfolio views. This is educational content, not investment advice.
Reviewed and maintained by Dojournal Editorial Team