
This guide explains how to install and start using the Dojournal SMC Indicator on MetaTrader 5, from placing the file in the Indicators folder to reading structure on the chart. It is a context tool, not an EA, and it does not place trades for you.
Test on a Demo account before using it live. Combine the indicator with a trading plan, risk management, and confirmation from multiple factors. Chart signals and zones do not guarantee a particular price movement.
1. Install the Indicator on MT5
- Download dojournal-mt5-indicator.ex5 from this article's attachment section.
- Open MetaTrader 5 and choose File > Open Data Folder.
- Open MQL5 > Indicators.
- Copy the .ex5 file into this folder only. The .mq5 source file is not required.
- Return to MT5, open Navigator, right-click Indicators > Refresh, or restart MT5.

2. Attach the Indicator to a chart
- Open the currency pair or asset you want to analyse.
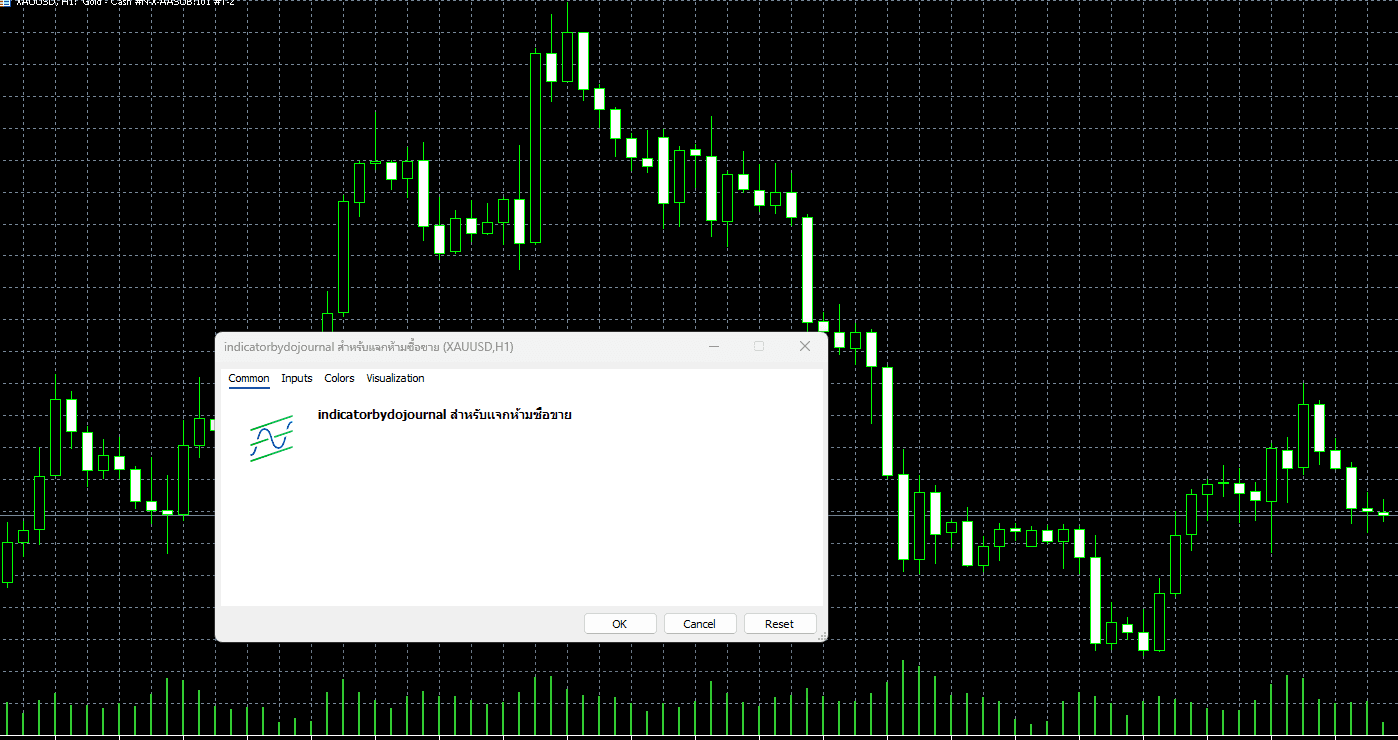
- In Navigator, open Indicators and drag the Dojournal Indicator onto the chart.
- Review the Inputs you want to use, then select OK.
- Adjust the chart colours and background so candles, zones, and labels remain easy to read.
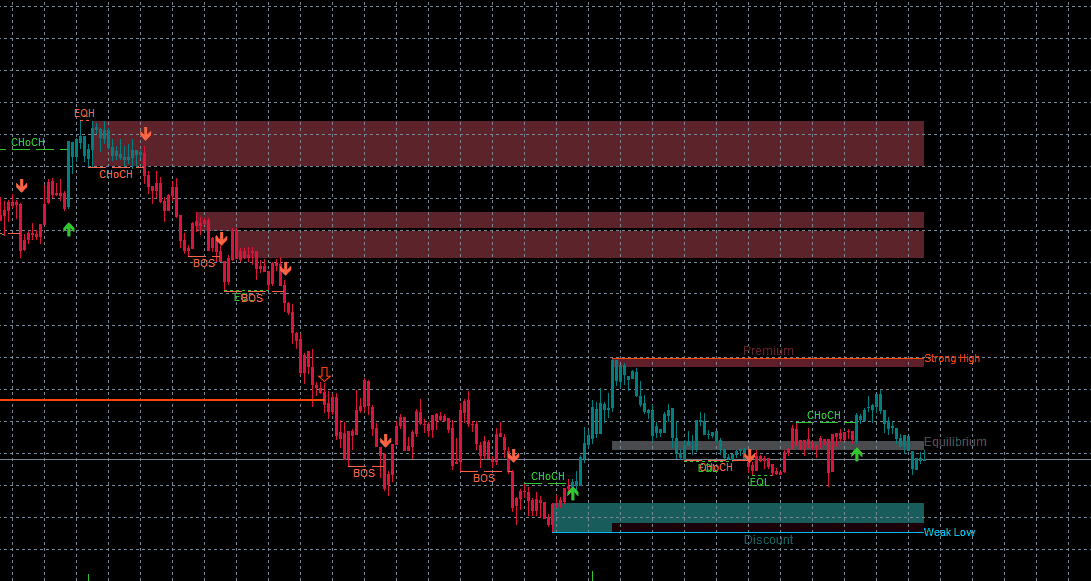
3. Read what the Indicator shows
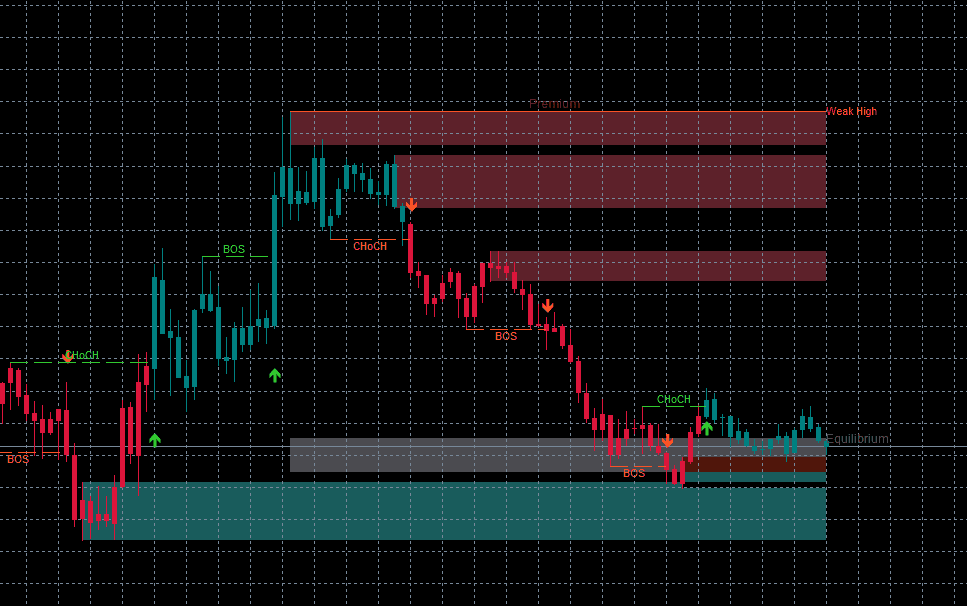
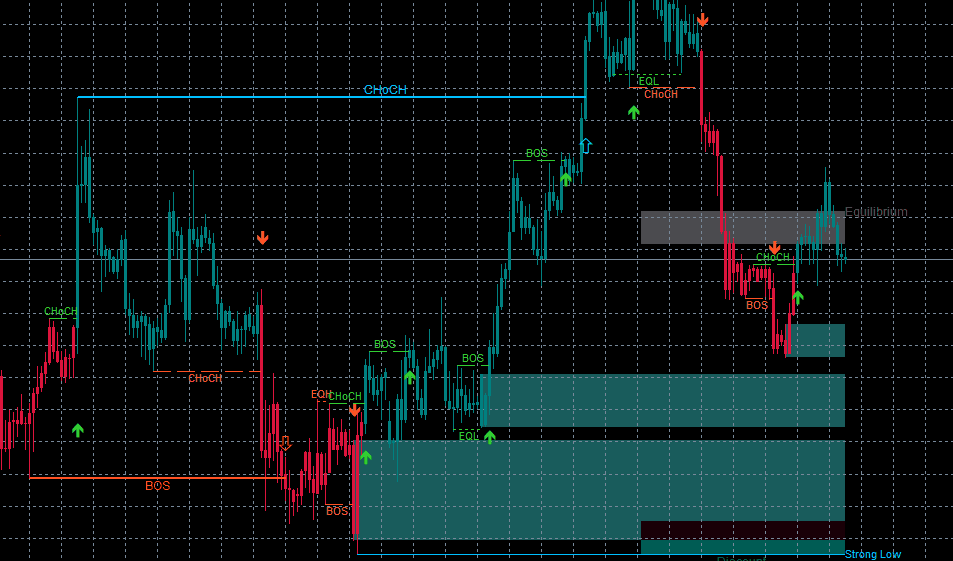
The Indicator separates structure into Internal Structure, which reacts faster to short-term changes, and Swing Structure, which highlights more significant highs and lows. Read BOS and CHoCH together with the broader structure; neither should be the only reason to open a trade.
- Order Blocks: zones where price may react. Check context and confirmation before using them.
- Equal Highs / Equal Lows: nearby highs or lows that help frame liquidity and structure.
- Fair Value Gaps: price gaps that can be enabled from Inputs once you understand how to read them.
- Premium / Discount: upper and lower areas of a price range used for context, not automatic entries.
4. Suggested starting settings
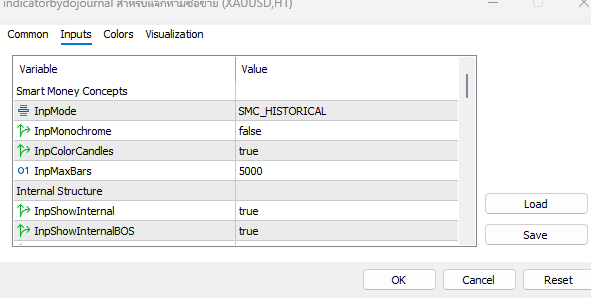
The default settings are designed to show structure immediately. Start with the defaults, then adjust one group at a time so you can see how each change affects the chart. You do not need every element enabled if the chart becomes difficult to read.
- Mode: start with Historical to review structure across the chart, then try Present when you are familiar with it.
- Internal Length = 5 and Swing Length = 50: a starting point for short-term and major structure.
- Keep Internal and Swing Structure visible while learning so you can compare the short-term view with the larger picture.
- Leave Fair Value Gaps off at first, then enable them when you want to study that element specifically.
- Max Bars = 5000 is useful for a broad view. Reduce it if the chart becomes slow.
5. Use the Indicator with your trading plan
A safer approach is to use the Indicator to organise information: read higher-timeframe structure first, mark areas to watch, and wait for confirmation from your own entry plan. Seeing BOS, CHoCH, or an Order Block alone should not be treated as a Buy or Sell instruction.
6. Download the usable file
This article's attachment is the .ex5 file for use on MT5 only. Source code is not distributed, and downloads require signing in to Dojournal.
Sources
The Dojournal editorial team checked the steps against the published file, the MetaTrader 5 interface, and primary platform documentation. Test the tool on a demo account and confirm broker conditions before real-money use.
Reviewed and maintained by Dojournal Editorial Team